Single experiment evaluation
This page describes the Single experiment evaluation case: scoring one experiment's results. Use it to check quality of a single prompt variant's outputs.
Case summary
| Scope | Input | Use case |
|---|---|---|
| Experiment (1 experiment) | One experiment's results | Score a single prompt variant's outputs. |
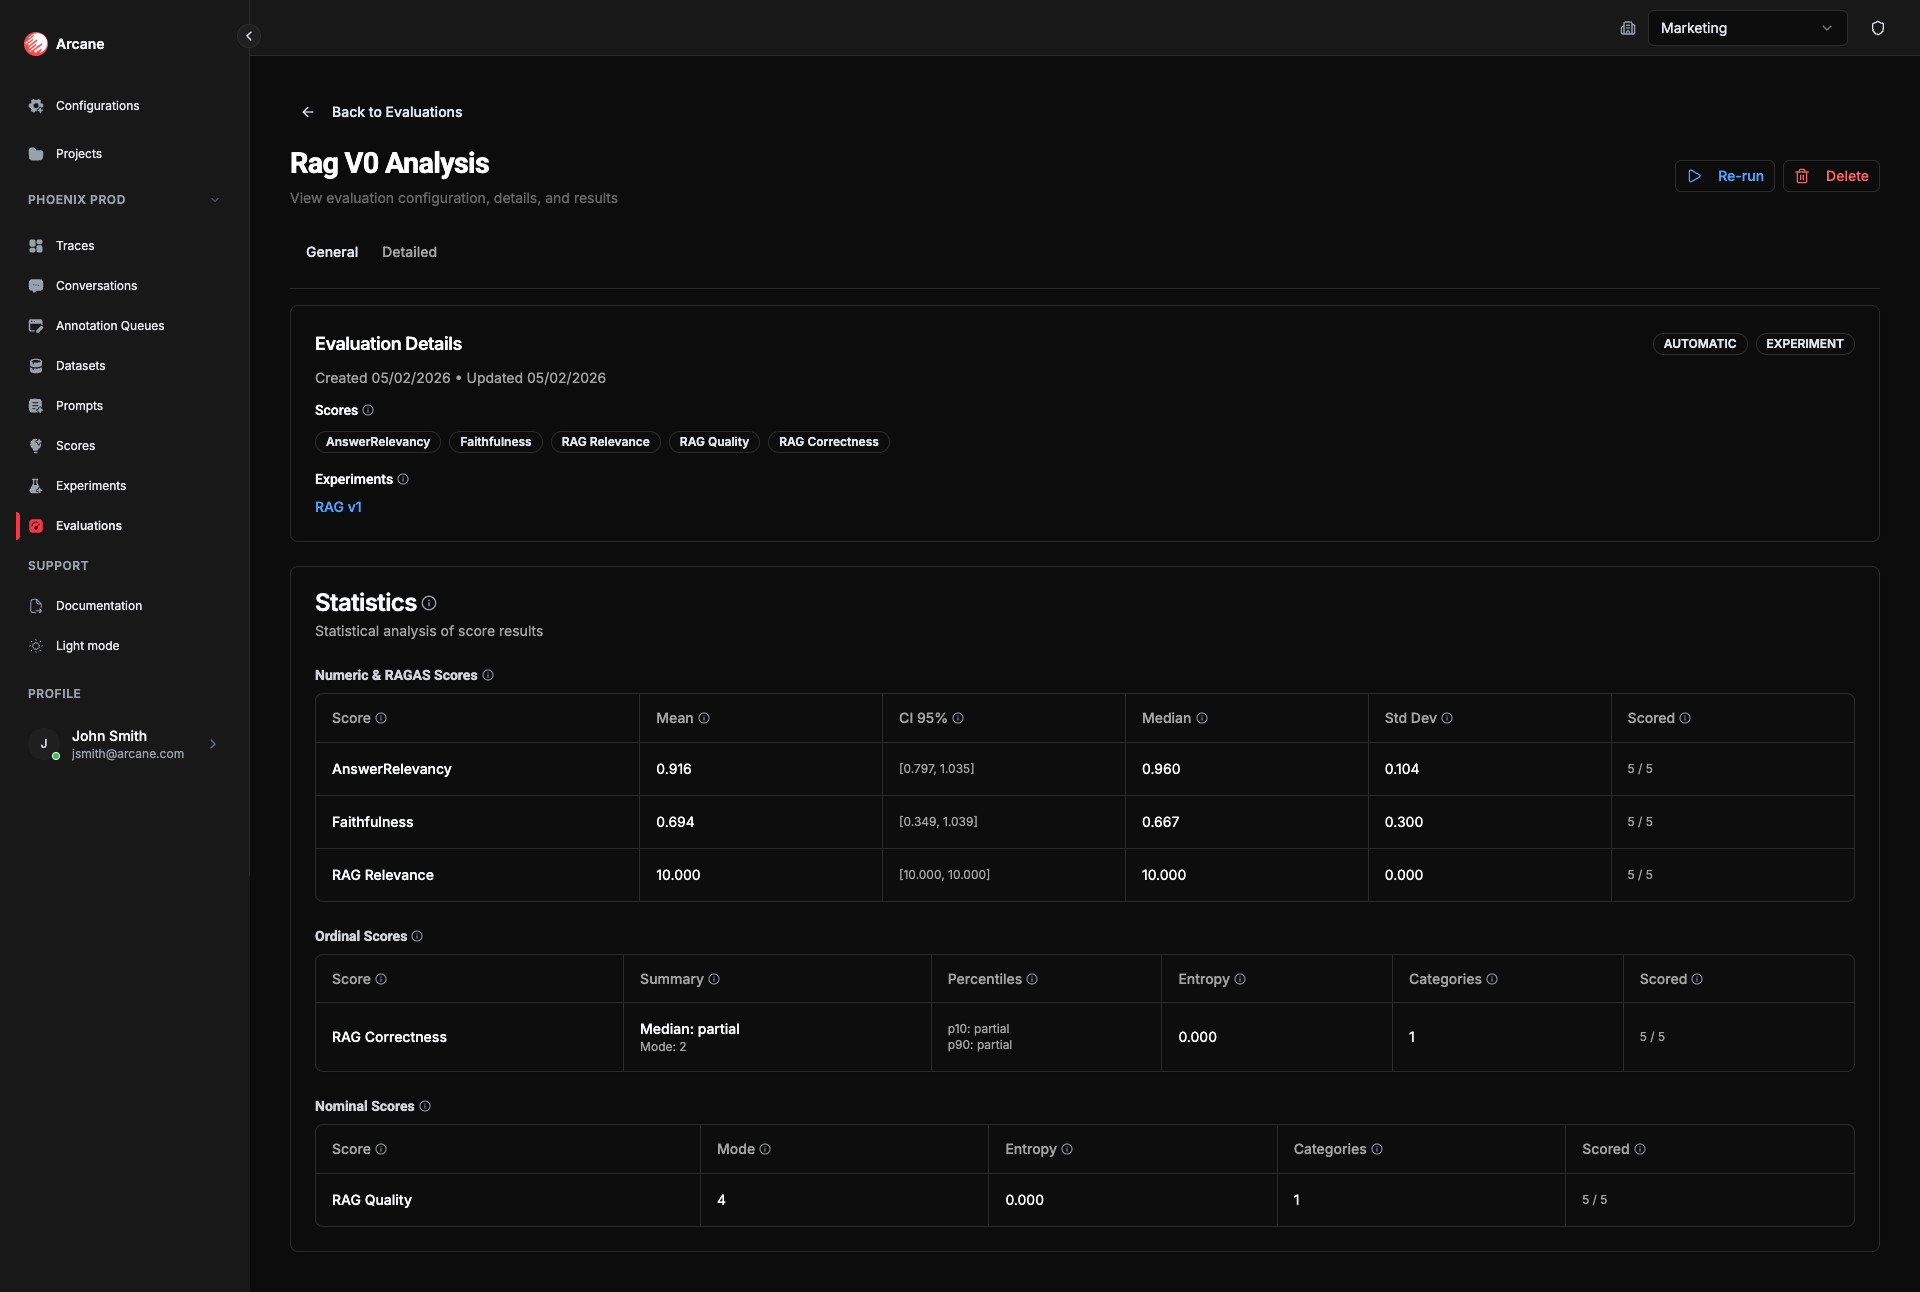
- General tab: Shows Experiments section (one experiment) and experiment-level statistics per score.
- Detailed tab: Dataset columns + experiment output + score columns per row.
There is no Comparison tab (only when 2+ experiments are selected). To compare variants, add multiple experiments — see Multiple experiment evaluation.
Creating a single-experiment evaluation
- Click New evaluation.
- Set Evaluation Scope to Experiment.
- Add one experiment and one or more Scores.
- Click Create Evaluation. The evaluation runs automatically.
Scores run on the experiment's outputs (one row per dataset row). The General tab shows statistics over all scored rows for that experiment.
Statistics
Summary statistics are shown on the General tab. They are computed over all scored rows for the single experiment. The exact metrics depend on the score type.
Why they matter: Statistics summarize how well this prompt variant performs on the dataset. The mean (or median for ordinal scores) tells you typical quality; the confidence interval shows how much you can trust that number; std dev and spread show consistency. Pass rate and tail metrics help you see whether outputs meet your bar. Use the Detailed tab to drill into low-scoring rows and improve prompts or data.
Numeric & RAGAS scores
For continuous scores (e.g. 0–1, 0–10):
| Statistic | What it means | Why useful |
|---|---|---|
| Mean | Average value across all scored rows. See Mean. | Use as the primary summary for numeric scores—track quality at a glance. |
| CI 95% | 95% confidence interval for the mean; wider CI = more uncertainty. See Confidence interval. | Judge whether a score is reliably good or bad and whether you need more data. |
| Median | Middle value (50th percentile). See Median. | Less sensitive to outliers than the mean—use for a robust typical value. |
| Std Dev | Standard deviation—measures spread. See Standard deviation. | See how consistent results are; low std dev = stable quality. |
| Scored | Number of rows with a score vs total rows (e.g. 45/50). | Spot gaps and know coverage. |
Ordinal scores
For ordered categories (e.g. Poor → Fair → Good):
| Statistic | What it means | Why useful |
|---|---|---|
| Summary | Median (typical category) and Mode (most common category). See Median, Mode. | See both central tendency and what the model outputs most often. |
| Percentiles | p10 and p90—10th and 90th percentile categories. See Percentile. | Show the range of responses. |
| Entropy | Measures diversity of responses. See Entropy. | Higher entropy = more spread across categories. |
| Categories | Number of distinct ordinal levels (e.g. 5 for a 1–5 scale). | Know the scale size. |
| Scored | Number of rows with a score vs total rows. | Spot gaps and know coverage. |
Additional ordinal metrics:
- Pass rate — Proportion of results in acceptable categories (based on score's Acceptable Set). Why useful: See what share of results meet your quality bar.
- Tail mass below — Proportion of results below a threshold rank (based on score's Threshold Rank). Why useful: See how many outcomes fall in the worst categories.
Nominal scores
For unordered categories (e.g. labels):
| Statistic | What it means | Why useful |
|---|---|---|
| Mode | Most frequent category. See Mode. | Shows the dominant label in the distribution. |
| Entropy | Measures diversity of responses. See Entropy. | Higher entropy = more spread across categories. |
| Categories | Number of distinct categories (labels). | Know how many distinct labels appear. |
| Scored | Number of rows with a score vs total rows. | Spot gaps and know coverage. |
Detailed tab
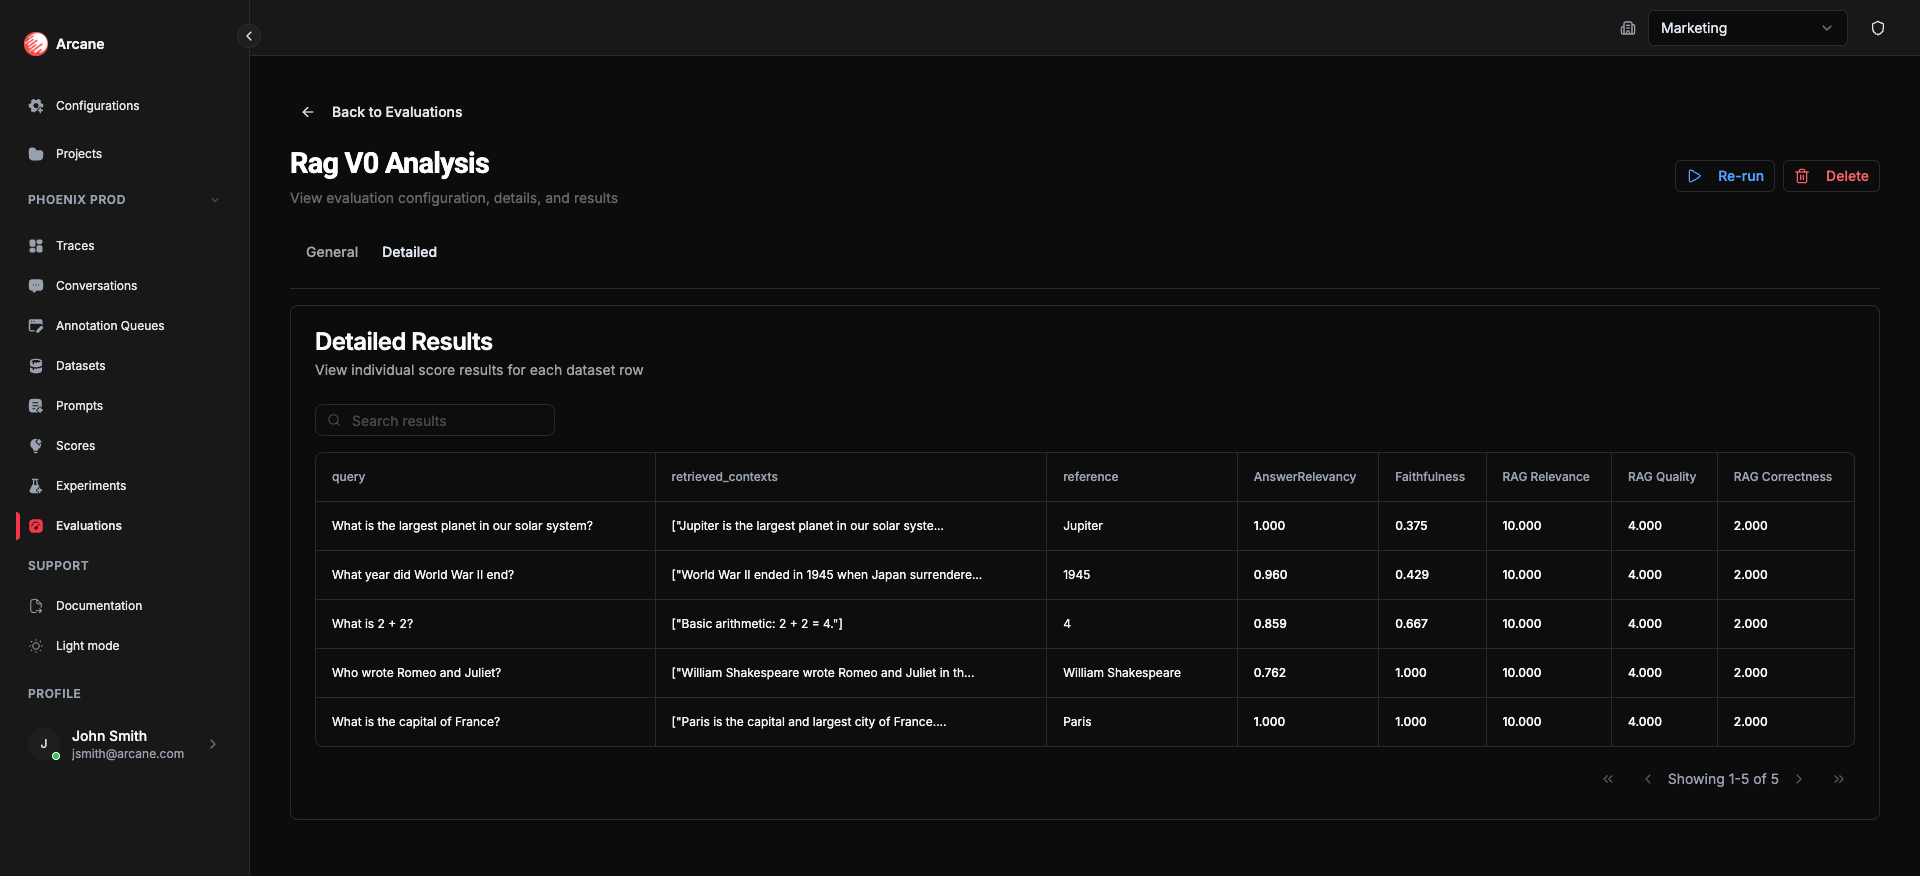
- Search results — filter rows.
- Table — dataset columns plus experiment output and score columns (one per score).
- Copy to clipboard — copy cell values.
- Pagination — navigate through rows.
Each row shows dataset inputs, the experiment output, and the score value for each metric.
Statistical references
For deeper understanding of the statistical concepts used in this evaluation case:
Descriptive statistics
- Mean — Wikipedia: Arithmetic mean
- Median — Wikipedia: Median
- Standard deviation — Wikipedia: Standard deviation
- Confidence interval — Wikipedia: Confidence interval
- Percentiles — Wikipedia: Percentile
- Mode — Wikipedia: Mode (statistics)
- Entropy — Wikipedia: Entropy (information theory)
Related
- Evaluations — overview and list.
- Dataset evaluation — scoring a dataset directly.
- Multiple experiment evaluation — scoring and comparing 2+ experiments.