Multiple experiment evaluation
This page describes the Multiple experiment evaluation case: scoring two or more experiments and comparing them. Use it to A/B test prompt or model variants on the same dataset with shared scores.
Case summary
| Scope | Input | Use case |
|---|---|---|
| Experiment (2+ experiments) | Two or more experiments' results | Compare prompt/model variants on the same dataset with shared scores. |
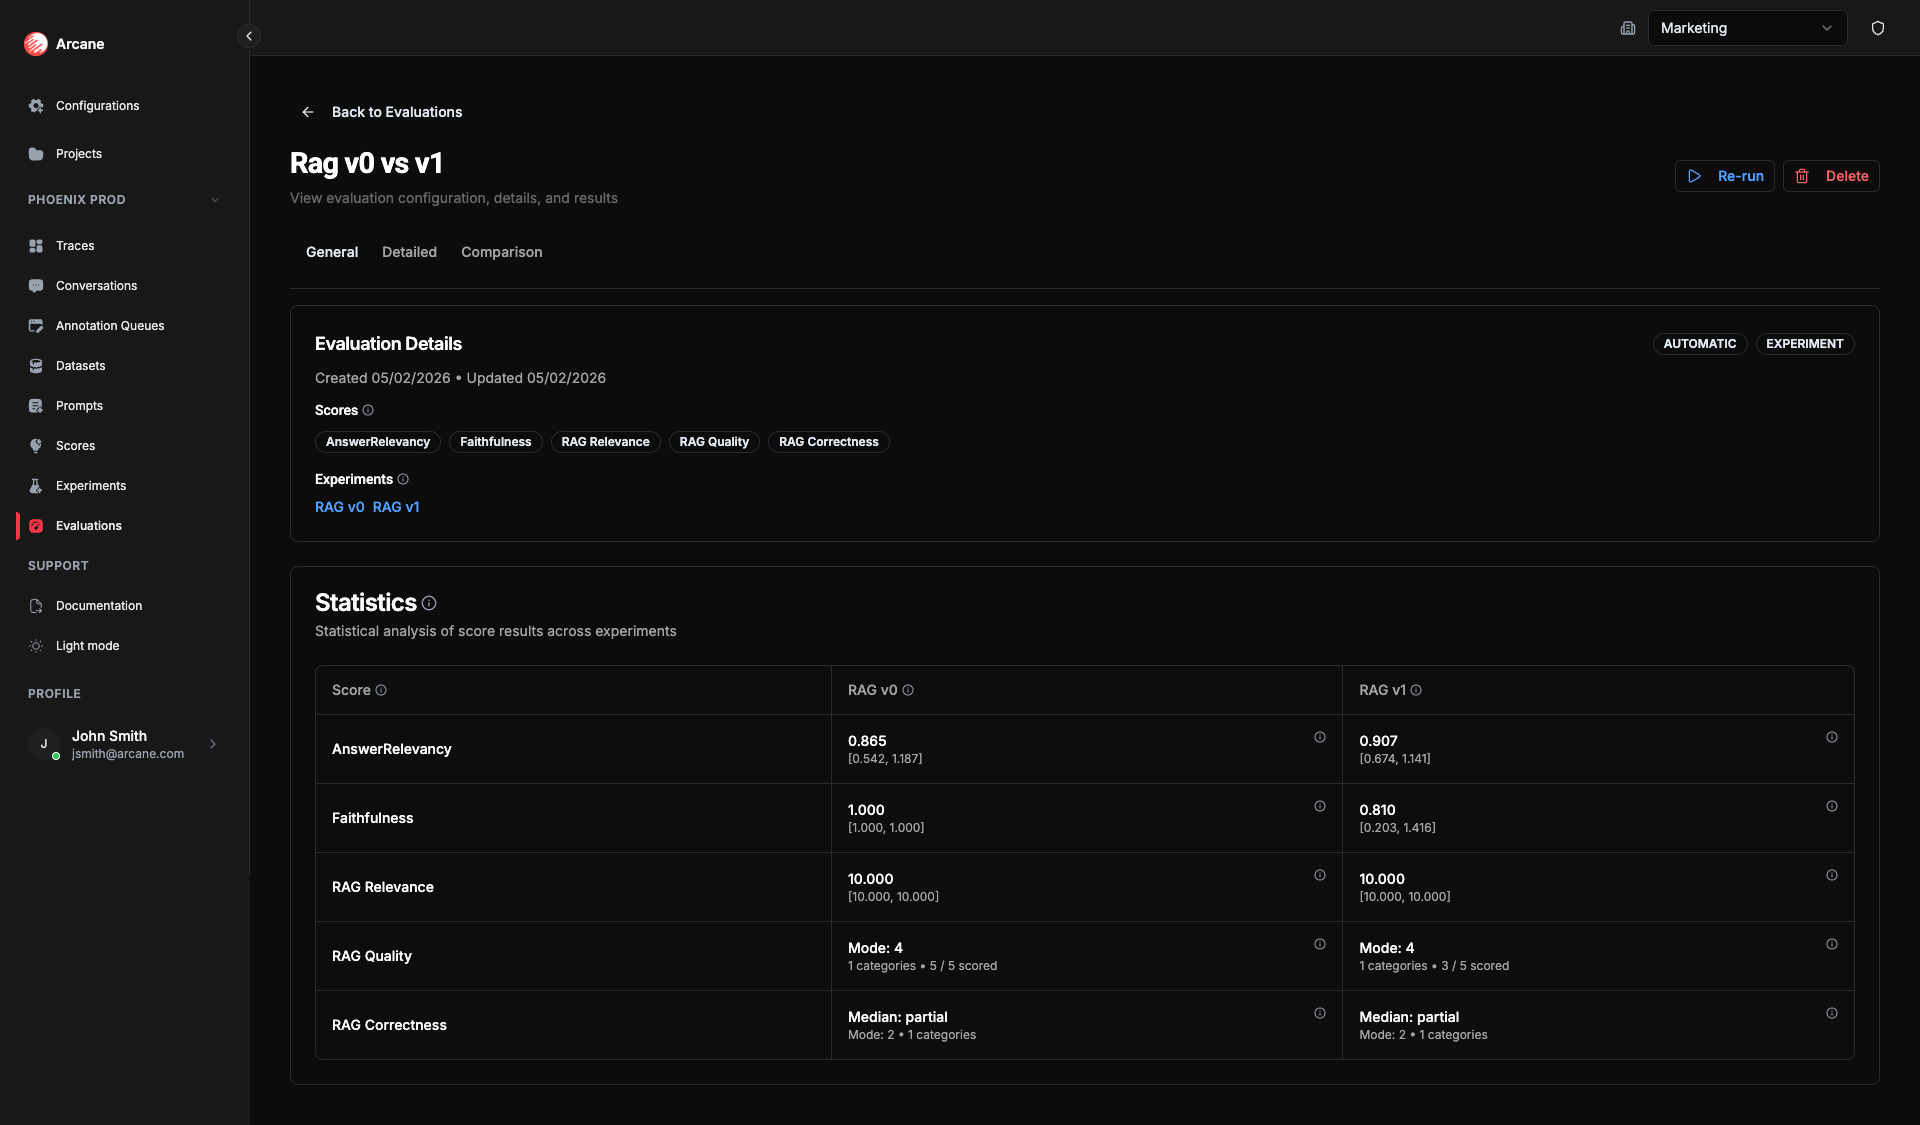
- General tab: Shows Experiments section (multiple experiments) and statistics per experiment for each score.
- Detailed tab: Dataset columns + outputs + score columns (per experiment when applicable).
- Comparison tab: Statistical comparison between two experiments for a selected score (paired analysis, effect sizes, charts).
Creating a multiple-experiment evaluation
- Click New evaluation.
- Set Evaluation Scope to Experiment.
- Add two or more experiments and one or more Scores.
- Click Create Evaluation. The evaluation runs automatically.
Scores run on each experiment's outputs. The General tab shows statistics for each experiment; the Comparison tab lets you pick two experiments (A and B) and one score to see paired comparison.
Statistics per experiment
On the General tab, each experiment gets the same set of summary statistics as in the single-experiment case — Mean, CI 95%, Median, Std Dev, Scored (for Numeric/RAGAS); Summary, Percentiles, Entropy, Pass rate, etc. (for Ordinal); Mode, Entropy, Categories, Scored (for Nominal). See Single experiment evaluation — Statistics for the full list.
These statistics are computed per experiment over that experiment's scored rows.
Why they matter: Per-experiment statistics let you compare variants at a glance (e.g. which has the higher mean or pass rate). For a deeper, row-by-row comparison, use the Comparison tab: it adds significance (p-value) and effect size so you can tell whether a difference is real and meaningful, not just noise — and make confident decisions about which prompt or model to ship.
Comparison tab
When an evaluation has 2 or more experiments, a Comparison tab appears. Use it to compare two experiments head-to-head on the same score.
Selecting experiments and score
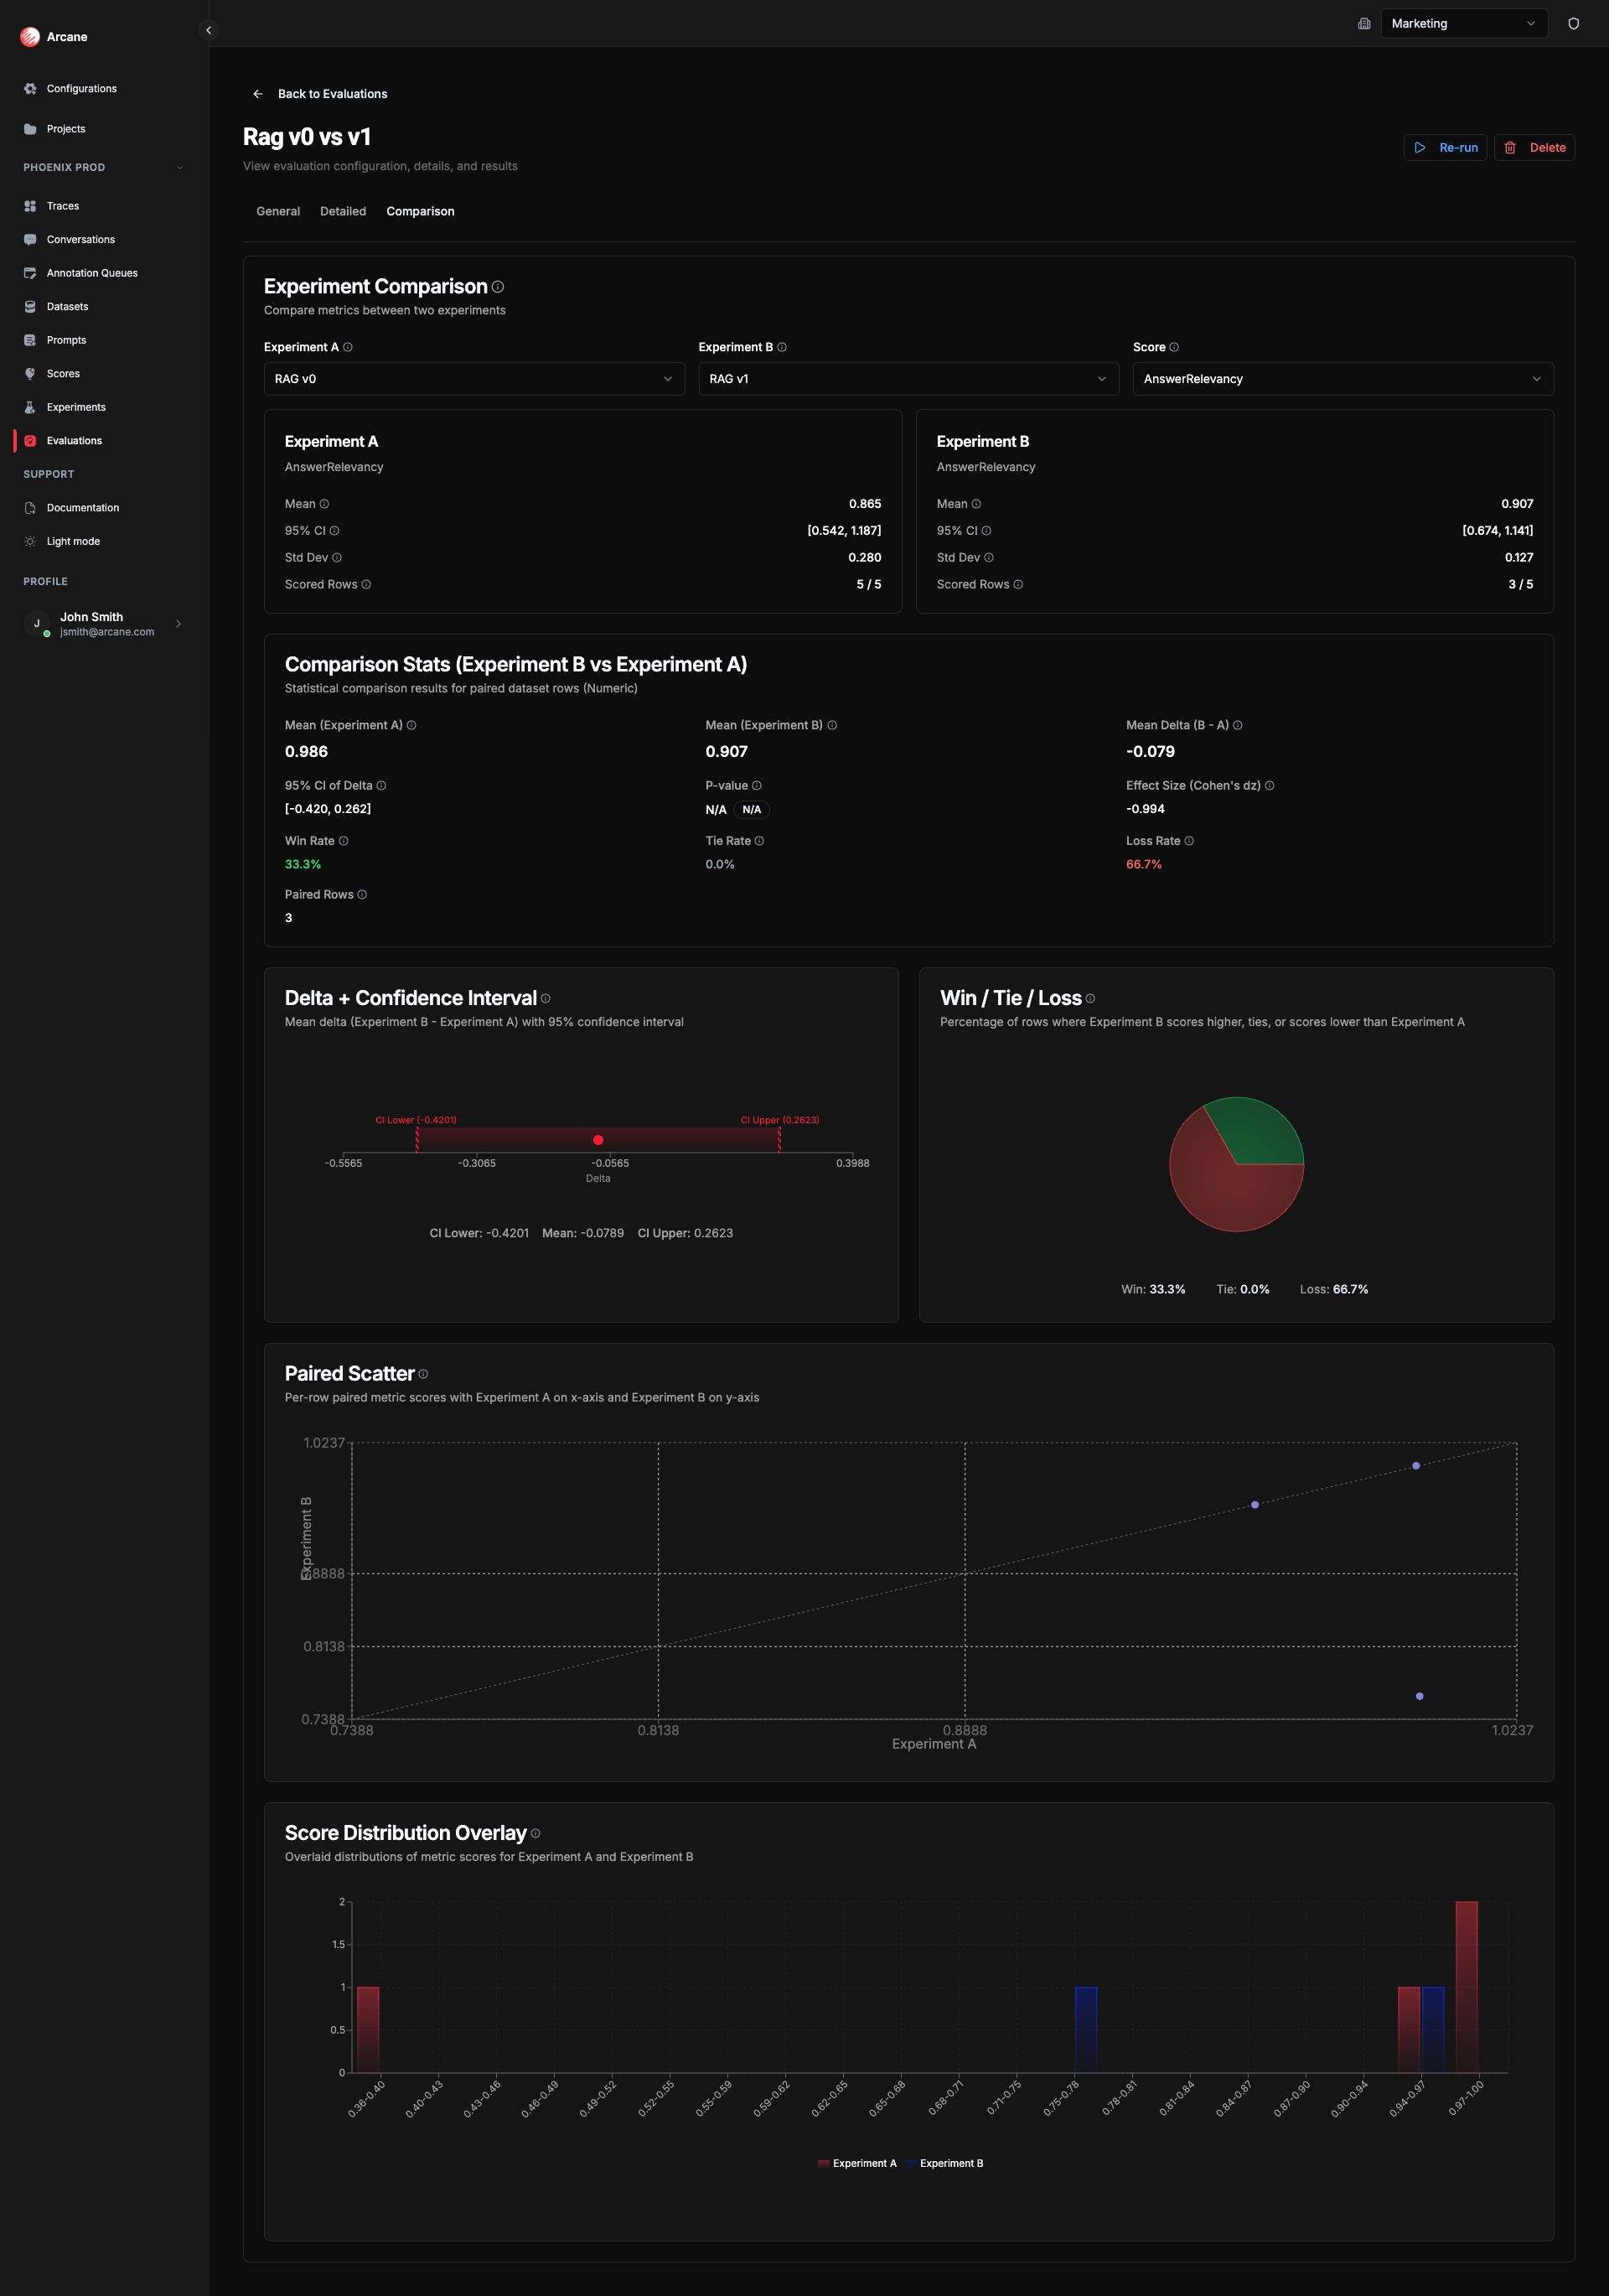
- Experiment A — Baseline experiment (reference). Metrics are compared as B vs A.
- Experiment B — Treatment experiment. Delta and Win/Tie/Loss show how B performs relative to A.
- Score — The evaluation metric to compare. Must have scored results in both experiments.
How comparison is calculated
All comparison statistics use paired data analysis — each dataset row is scored in both experiments, so rows are aligned and we can compute deltas and significance. See Paired difference test for background.
Why comparison helps: The mean delta and win/tie/loss rates show whether B beats A. The p-value and confidence interval tell you if that difference is statistically significant (unlikely to be chance). The effect size (e.g. Cohen's dz or Cliff's delta) tells you how big the improvement is in practice. Together they let you decide with confidence: ship the better variant, or run more data if the result is unclear.
Statistics and charts vary by score type.
Numeric & RAGAS comparison
| Statistic | What it means | Why useful |
|---|---|---|
| Mean (A) | Mean score for Experiment A across paired rows. | Baseline level for comparison. |
| Mean (B) | Mean score for Experiment B across paired rows. | Treatment level for comparison. |
| Mean Delta (B - A) | Difference in means. Positive = B scores higher on average. | Quick read on direction of change. |
| 95% CI of Delta | 95% confidence interval for the mean delta (t-based). See Confidence interval. | If it excludes 0, the difference is statistically significant—tells you if the delta is reliable. |
| P-value | "Is this difference real or just noise?" Below 0.05 = likely real; above = could be chance. Permutation test. See P-value, Permutation test. | Use with effect size to judge whether it matters in practice. |
| Effect Size (Cohen's dz) | How large is the difference? Small (~0.2), moderate (~0.5), large (~0.8). See Cohen's d. | Judge whether the improvement from B over A is meaningful for your use case. |
| Win Rate | Proportion of rows where B scores higher than A. | See at a glance how often B beats A. |
| Tie Rate | Proportion of rows where both have the same score. | See how often results match. |
| Loss Rate | Proportion of rows where B scores lower than A. | See how often A wins. |
| Paired Rows | Number of rows with scores for both experiments. | Know how many rows support the comparison. |
Numeric & RAGAS comparison charts
- Delta + Confidence Interval — Mean delta (B - A) with 95% CI. Bar shows point estimate; confidence interval shows uncertainty.
- Win / Tie / Loss — Pie breakdown for each row: B scores higher (win), same (tie), or lower (loss).
- Paired Scatter — Each point is one dataset row: x = Experiment A score, y = Experiment B score. Points above the diagonal = B > A, below = A > B.
- Score Distribution Overlay — Overlaid histograms of scores for each experiment. Compare shape and spread.
Ordinal comparison
| Statistic | What it means | Why useful |
|---|---|---|
| Paired Rows | Number of dataset rows with scores for both experiments. | Know how many rows support the comparison. |
| Median Comparison | The middle category for each experiment. | See the typical response level for A vs B. |
| Cliff's Delta | How much better or worse is B than A for ordered categories? Range [-1, 1]. See Cliff's delta. | Like Cohen's dz but for ordinal data—effect size for categories. |
| Probability of Superiority | What share of rows does B score higher than A? See Probability of superiority. | Direct answer to "how often does B beat A?" |
| Pass Rate | What share of results meet your quality bar? | Compare A vs B to see which experiment passes more often. |
| Tail Risk | What share of results fall in the worst categories? Lower is better. | Compare A vs B to see which has fewer bad outcomes. |
| Wilcoxon Signed-Rank P-value | Wilcoxon test for paired ordinal data. See Wilcoxon signed-rank test. | "Does B tend to score higher than A?" Below 0.05 = likely a systematic shift. |
| Distribution Comparison | Category proportions sorted by rank. | See how the distribution shifts between experiments. |
Ordinal comparison charts
- Distribution Comparison — Category proportions sorted by rank. Shows how the distribution shifts between experiments.
- Pass Rate — Proportion of results in acceptable categories for each experiment.
- Tail Risk — Proportion of results below a threshold rank.
Nominal comparison
| Statistic | What it means | Why useful |
|---|---|---|
| Paired Rows | Number of dataset rows with scores for both experiments. | Know how many rows support the comparison. |
| Cramér's V | How strongly does the experiment affect which category appears? 0 = no link; 1 = strong. See Cramér's V. | See if A and B produce different label distributions. |
| Bowker's test P-value | Bowker's test for paired nominal data. See Bowker's test. | "Do A and B produce different category distributions?" Below 0.05 = likely different. |
| Entropy Difference | How much more or less varied are B's responses? See Entropy. | Positive = B uses more categories; negative = B is more concentrated. |
| Distribution Comparison | How often each category appears in A vs B; delta and CI per category. | See whether the change per category is reliable. |
Nominal comparison charts
- Distribution Comparison — Side-by-side category proportions. Compare how often each label appears in A vs B.
- Category Delta — Change in proportion per category (B - A). Error bars show confidence intervals.
Comparison helps you determine which experiment variant performs better on a given score, with statistical significance and effect size to guide decisions.
Statistical references
For deeper understanding of the statistical concepts used in this evaluation case (including comparison):
Descriptive statistics
- Mean — Wikipedia: Arithmetic mean
- Median — Wikipedia: Median
- Standard deviation — Wikipedia: Standard deviation
- Confidence interval — Wikipedia: Confidence interval
- Percentiles — Wikipedia: Percentile
- Mode — Wikipedia: Mode (statistics)
- Entropy — Wikipedia: Entropy (information theory)
Hypothesis testing and effect sizes
- P-value — Wikipedia: P-value
- Cohen's d — Wikipedia: Cohen's d
- Wilcoxon signed-rank test — Wikipedia: Wilcoxon signed-rank test
- Bowker's test — Wikipedia: Bowker's test of symmetry
- Cramér's V — Wikipedia: Cramér's V
Effect sizes for ordinal data
- Cliff's delta — Wikipedia: Cliff's delta
- Probability of superiority — Wikipedia: Effect size#Probability of superiority
Paired comparisons
- Paired data analysis — Wikipedia: Paired difference test
- Permutation test — Wikipedia: Permutation test
Related
- Evaluations — overview and list.
- Dataset evaluation — scoring a dataset directly.
- Single experiment evaluation — scoring one experiment's outputs.