Traces
Traces show the step-by-step execution of your AI workflows. Each trace is a tree of spans—the individual steps (model calls, tool calls, etc.). Arcane connects to trace backends in standard OpenTelemetry format. See Core Observability Concepts for the underlying concepts.
Prerequisites
- Datasource configured (Tempo, Jaeger, ClickHouse, or Custom API). See Datasources.
- Entities configured so spans show human-friendly labels (Model, Tool, etc.) and message reconstruction works. See Entities.
Search page
From Traces in the sidebar, you search for traces by time range, datasource, and query.
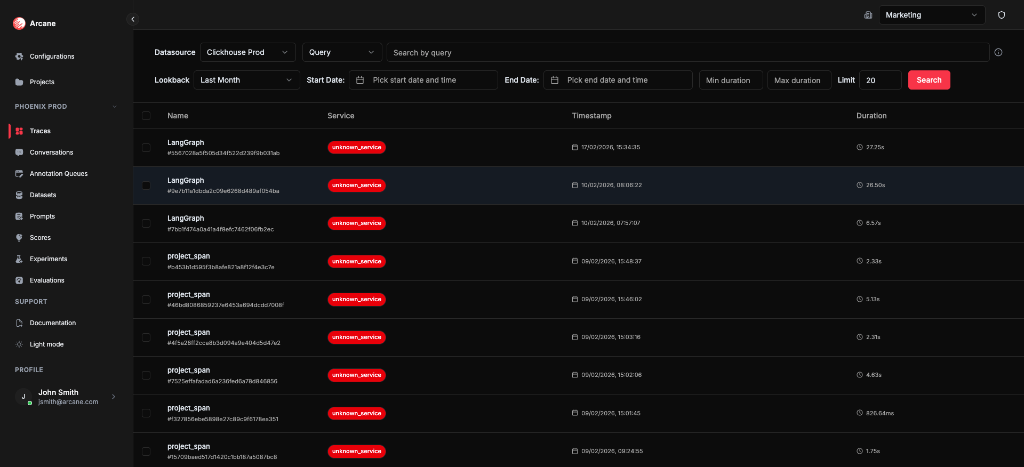
Search bar
| Control | What it does |
|---|---|
| Time range | Last hour, Last 24 hours, Last 7 days, Last month, or custom dates. |
| Datasource | Choose which trace backend to query (e.g. ClickHouse). |
| Search | Find traces by name or ID. |
| Attributes filter | Filter by span attributes. Query syntax depends on the datasource — see Query syntax by datasource below. |
Tip: Use Last month and ClickHouse (or your datasource) to see results quickly.
Query syntax by datasource
The search/query string you enter is interpreted differently depending on which datasource you select.
Tempo
Arcane uses TraceQL — Grafana Tempo's query language. See the TraceQL documentation for syntax and examples.
ClickHouse
The query string (q) is parsed and turned into ClickHouse conditions on SpanAttributes and ResourceAttributes. All conditions are checked against both maps.
EQUALS — attribute = "value" (value must be in double quotes):
| Example | Description |
|---|---|
session.id = "453" | session.id equals "453" |
.service.name = "test" | .service.name equals "test" |
gen_ai.request.model = "gpt-4" | gen_ai.request.model equals "gpt-4" |
EXISTS — attribute EXISTS (attribute must be present):
| Example | Description |
|---|---|
session.id EXISTS | session.id must be present |
project.id EXISTS | project.id must be present |
has() — has(attribute) (same as EXISTS):
| Example | Description |
|---|---|
has(session.id) | session.id must be present |
has(project.id) | project.id must be present |
AND / OR combinations:
| Example | Description |
|---|---|
session.id = "453" AND status = "active" | Both conditions must match |
session.id = "453" OR user.id = "123" | Either condition can match |
(session.id = "453" OR user.id = "123") AND status = "active" | Grouping with parentheses |
Limits: Attribute names up to 500 chars; values up to 10,000 chars. Only =, EXISTS, and has() are supported — other operators (e.g. >, <) are ignored.
Custom API
The query is passed directly to your backend. Use whatever query language or syntax your custom trace backend expects.
Jaeger
Arcane uses Jaeger's native query capabilities. Refer to your Jaeger version's documentation for supported query syntax.
Trace list
- Matching traces appear with trace IDs, timestamps, and basic info.
- Click a trace to open the detail view.
- You can add traces to annotation queues from the list (multi-select) or from the trace header. For the various ways to annotate data, see Annotation Queues.
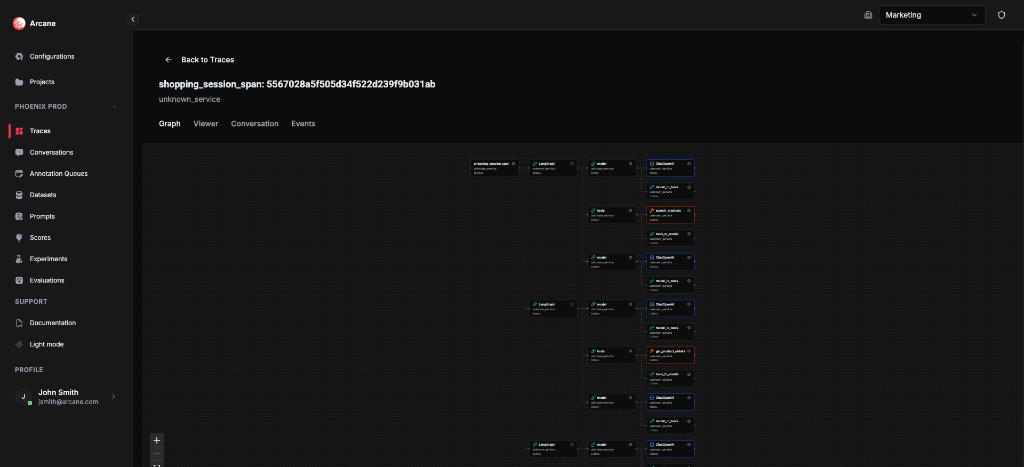
Trace detail
When you open a trace, you see four main tabs: Graph, Viewer, Conversation, and Events.
Header
- Back to Traces — return to the search list.
- Trace ID — e.g.
shopping_session_span: 5567028a5f505d34f522d239f9b031ab. - Metadata — Env (service), Latency, timestamp.
- + Add to annotation queue — enqueue this trace.
- Annotate — open the annotation sidebar to answer queue questions for this trace. See Annotation Queues — Annotate from trace or conversation detail.
Graph tab
A visual flow of spans and their relationships. Useful for understanding execution order and parent-child links at a glance.
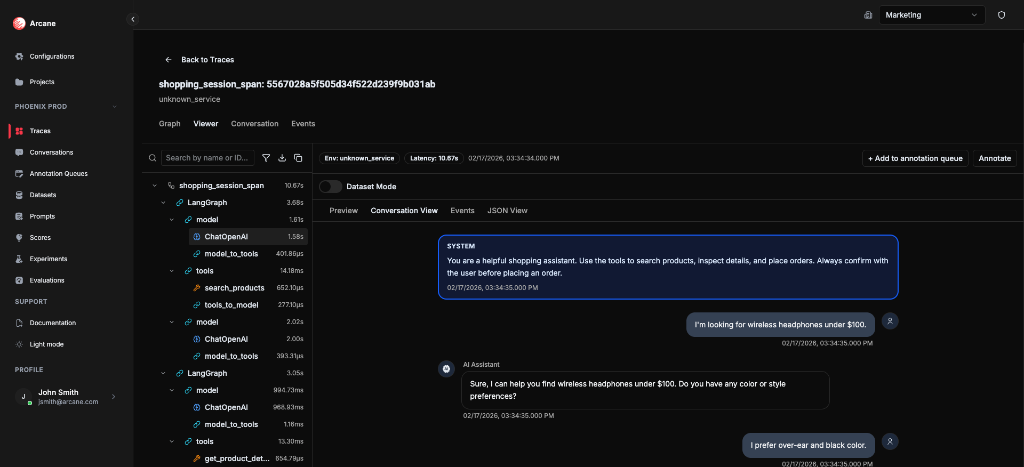
Viewer tab
The Viewer shows a span tree on the left and a detail panel on the right. Select a span to see its attributes, events, and (for model spans) the reconstructed conversation.
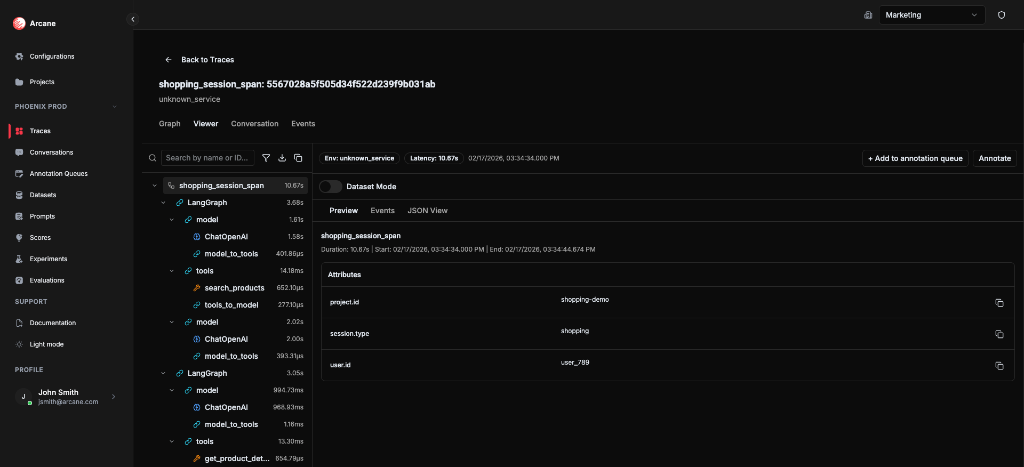
Span tree (left)
- Hierarchical list of spans with durations.
- Expand/collapse nodes.
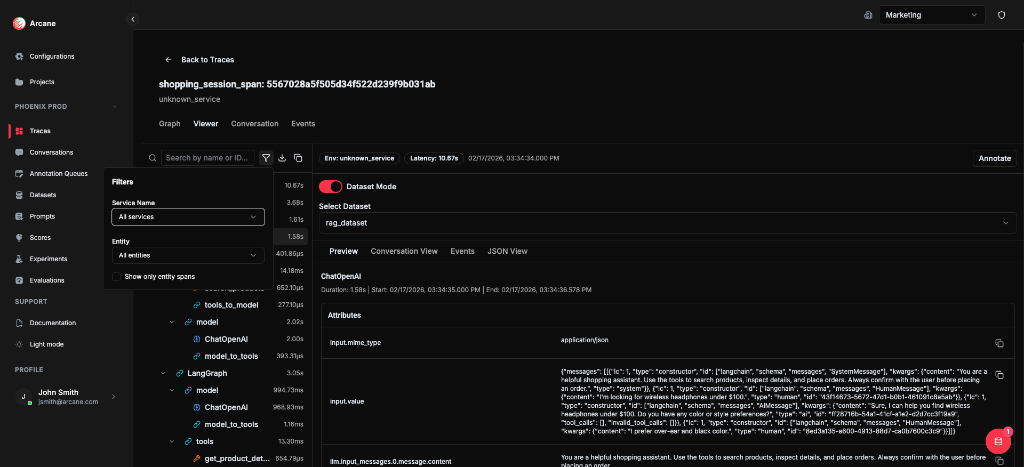
- Search by name or ID — filter spans in the tree.
- Filters — filter by Service Name, Entity, or “Show only entity spans”.
- Download — download the selected span as JSON.
- Copy whole trace as JSON — copy the full trace to the clipboard.
Detail panel (right)
For the selected span, the panel has four sub-tabs. What you see in each depends on your configuration (especially Entities).
Preview
- What it shows: A table of all span attributes (key/value). If the span matches an entity that has highlights configured, those stats (e.g. latency, token count, error flag) are shown at the top as quick-read values.
- What you need: Nothing required—every span has attributes. To see entity highlights, you need Entities configured with matching rules that match this span and Highlights defined (e.g. latency, token count). The span tree and filters also use entity matching for badges and "Show only entity spans". If you use Dataset Mode, you need a dataset created in the project; in Preview you then right-click an attribute to map it to a dataset column.
Conversation View
- What it shows: A reconstructed chat thread for that span: the input messages the model saw, the model's response, and any tool calls or tool results. Shown as a readable conversation (user / assistant / tool) instead of raw attributes.
- What you need: The span must be recognized as a model (or similar) entity. You need Entities with: (1) a matching rule that matches this span (e.g. attribute
openinference.span.type=MODEL, orgen_ai.request.modelregex), and (2) Message reconstruction configured for that entity—either canonical (one attribute with a JSON array of messages) or flat (patterns for role/content/tool fields in separate attributes). The span must emit the attributes your message matching expects (e.g. OpenInference or your SDK's message fields). If the span doesn't match an entity with message matching, or has no message attributes, the Conversation View sub-tab may be empty or not show a full thread.
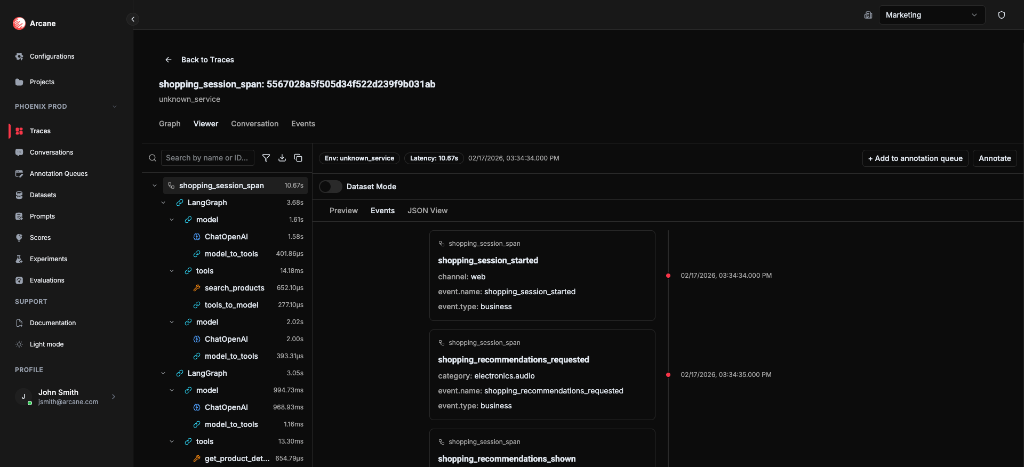
Events
- What it shows: All OTLP events attached to this span, in time order (e.g.
model_call_started,tool_call_started,exception). Each event has timestamp, name, and optional attributes. - What you need: Nothing to configure. Events are read from the span data. If the span has no events, the list is empty. See Events for the trace-level Events tab and filters.
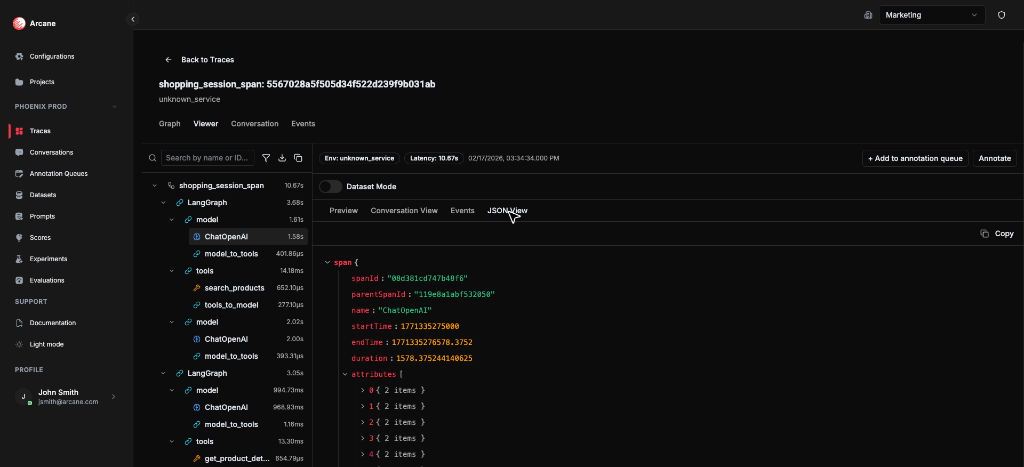
JSON View
- What it shows: The raw span payload as JSON (expandable). Useful for debugging or when an attribute isn't surfaced in Preview or Conversation View.
- What you need: Nothing. Always available for every span.
Entity labels and highlights (span tree and Preview)
Spans that match your Entities configuration show an entity badge in the span tree (e.g. Model, Tool) and highlights in the Preview sub-tab. For entities with message reconstruction configured, the Conversation View sub-tab shows the reconstructed chat. See the Detail panel sub-tabs above for what each requires.
You can map span attributes into dataset columns using Dataset Mode in the Viewer (turn on the toggle, select a dataset, then right-click attributes in the Preview sub-tab). For the full steps and screenshots, see Datasets — Dataset Mode.
Conversation tab
Shows the full conversation reconstructed from model spans in the trace. Messages are extracted using each entity’s message matching (canonical or flat), then merged, deduplicated, and sorted by time.
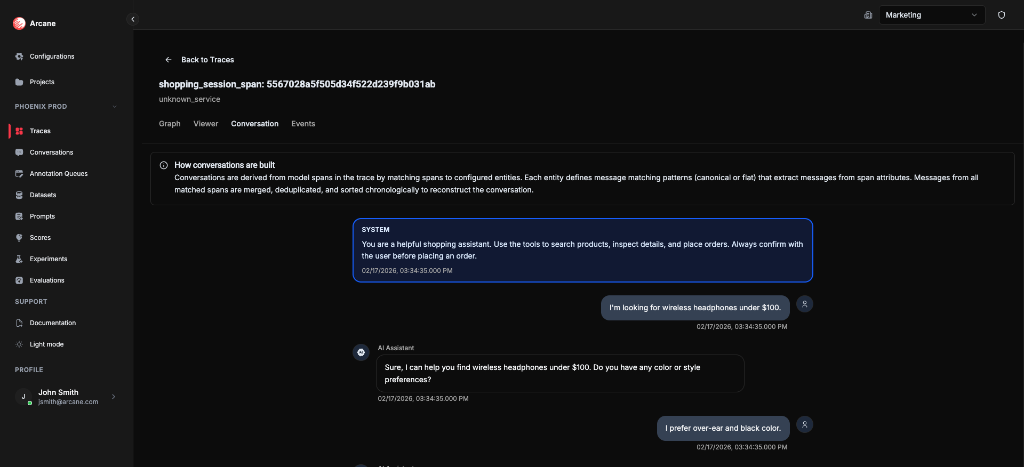
An info box explains: Conversations are derived from model spans in the trace by matching spans to configured entities. Each entity defines message matching patterns (canonical or flat) that extract messages from span attributes. Messages from all matched spans are merged, deduplicated, and sorted chronologically to reconstruct the conversation.
This view is useful for following the full chat flow (user, assistant, tool calls, tool results) without opening individual spans.
Events tab
A chronological list of OTLP events from all spans in the trace. Events are business or technical markers (e.g. model_call_started, tool_call_started, shopping_session_started). For more on how events work in the UI, see Events.
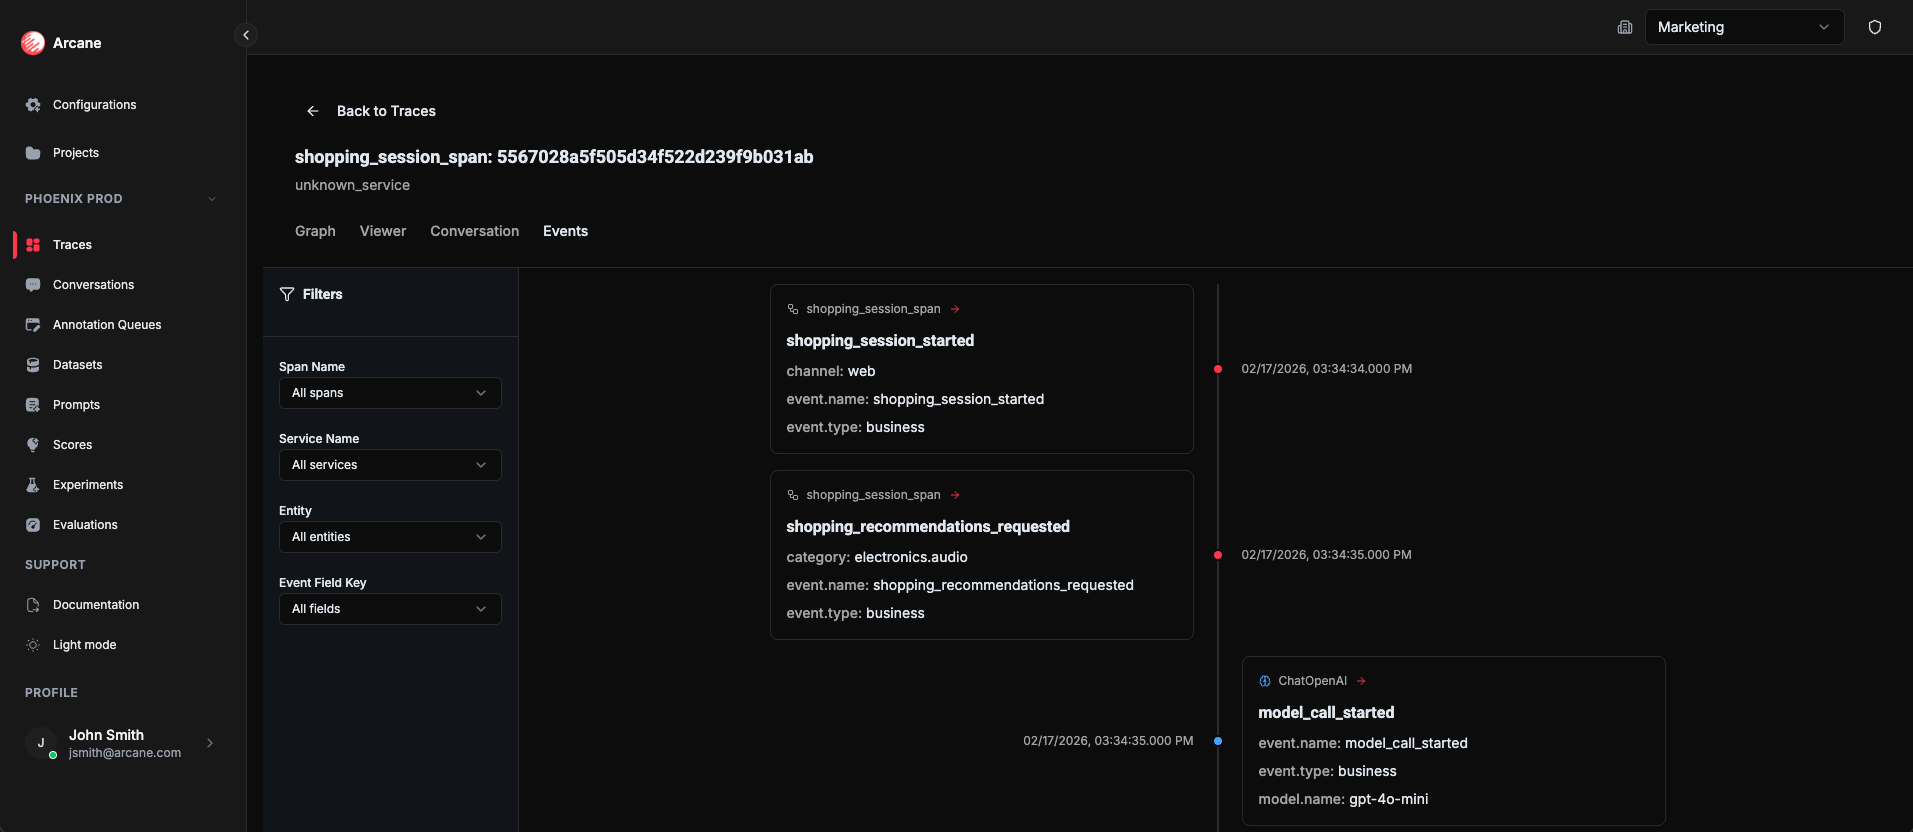
Filters:
- Span Name — filter by span.
- Service Name — filter by service.
- Entity — filter by entity.
- Event Field Key — filter by event attribute.
Click an event to jump to its span in the Viewer.
To answer annotation questions for this trace without leaving the view, use Annotate in the header; a sidebar opens where you pick a queue and submit answers. For the full steps and screenshot, see Annotation Queues — Annotate from trace or conversation detail.
When to use
- Debug a failed request — follow the span tree to find errors or slow steps.
- Inspect model I/O — use Conversation View or the main Conversation tab to see inputs and outputs.
- Filter by entity — find tool failures or slow model calls.
- Build datasets — use Dataset Mode to map attributes into columns for evaluations.
- Annotate for review �— add traces to queues and answer questions for quality tracking.
Related
- Core Observability Concepts — how traces and conversations are built.
- Events — how events appear in the trace UI.
- Entities — matching, highlights, and message reconstruction.
- Datasources — connecting trace backends.
- Annotations & Queues — queues, questions, and annotations.
- Datasets — datasets for evaluations and experiments.