Conversations
Conversations are stitched sessions—multiple traces grouped by a conversation ID (e.g. gen_ai.conversation.id). Arcane replays the full user journey as a chat thread. See Core Observability Concepts for the underlying concepts.
Prerequisites
- Datasource configured (Tempo, Jaeger, ClickHouse, or Custom API). See Datasources.
- Conversation stitching configuration in Organisation Configuration → Conversation, so sessions are stitched correctly. The configuration defines which span attributes (e.g.
gen_ai.conversation.id) are used to group traces into conversations. - Entities configured so spans show human-friendly labels and message reconstruction works. See Entities.
Search page
From Conversations in the sidebar, you search for conversations by time range, datasource, and configuration.
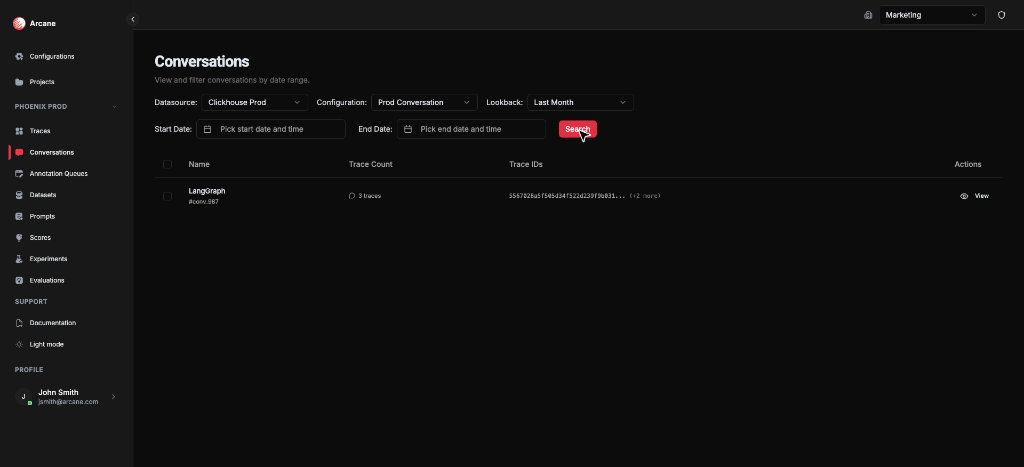
Search bar
| Control | What it does |
|---|---|
| Datasource | Choose which trace backend to query (e.g. ClickHouse). |
| Configuration | Choose the conversation stitching configuration (from Organisation Configuration → Conversation). |
| Lookback | Last minute, Last 5 minutes, Last hour, Last 24 hours, Last week, Last month, Last year, or Custom. |
| Start Date / End Date | For Custom lookback, pick the date range. |
| Search | Run the search. |
Tip: Use Last month and your datasource to see results quickly.
Conversation list
- Matching conversations appear with Name (e.g.
LangGraph #conv_987), Trace Count, and Trace IDs. - Click View to open the conversation detail.
- You can add conversations to annotation queues from the list (multi-select) or from the conversation header. For the various ways to annotate data, see Annotation Queues.
Conversation detail
When you open a conversation, you see three main tabs: Conversation, List, and Trace.
Header
- Back to Conversations — return to the search list.
- Conversation ID — e.g.
conv_987. - Metadata — Service name and number of traces merged (e.g.
3 traces merged). - Add to Annotation Queue — enqueue this conversation.
- Annotate Conversation — open the annotation sidebar to answer queue questions for this conversation. See Annotation Queues — Annotate from trace or conversation detail.
Conversation tab
- What it shows: The full chat replay: system prompt, user messages, AI assistant responses, tool calls, and tool results. Messages are extracted from model spans using entity message matching, then merged, deduplicated, and sorted by time.
- What you need: Entities with message reconstruction configured for the model (and any other) spans in the conversation. Each entity must have a matching rule that matches the relevant spans and a message matching pattern (canonical or flat) so Arcane can read role/content/tool fields from span attributes. Spans must emit those attributes (e.g. OpenInference or your SDK's message fields). Without matching entities and message attributes, the Conversation tab may be empty or show only partial messages. A conversation stitching configuration (Organisation Configuration → Conversation) is also required so traces are grouped into this conversation in the first place.
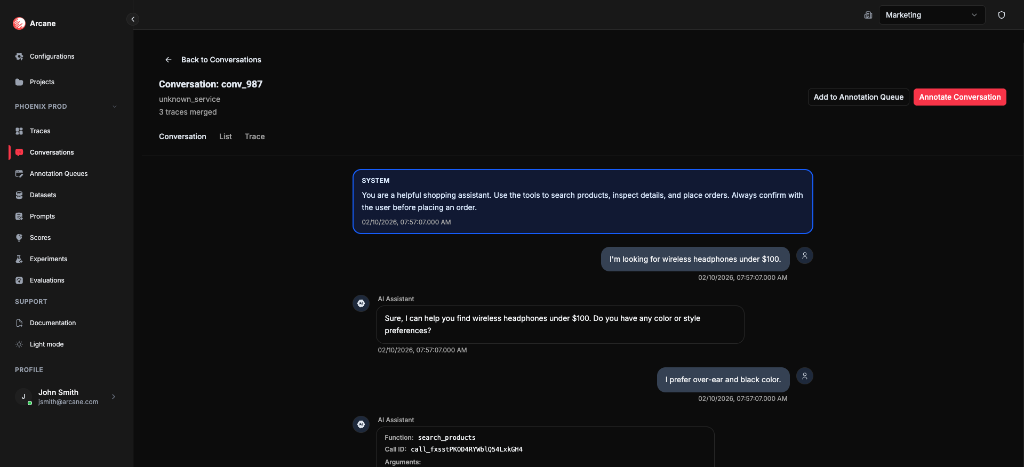
Use this view to follow the full user journey without opening individual traces.
List tab
- What it shows: The constituent traces that make up the conversation. Each trace card shows span name, trace ID, timestamp, duration, span count, View Trace (open that trace in the Traces detail view), and Annotate (open the annotation sidebar for that trace).
- What you need: Nothing beyond what you used to open the conversation (datasource, conversation stitching configuration). The list is built from the traces that were grouped into this conversation.
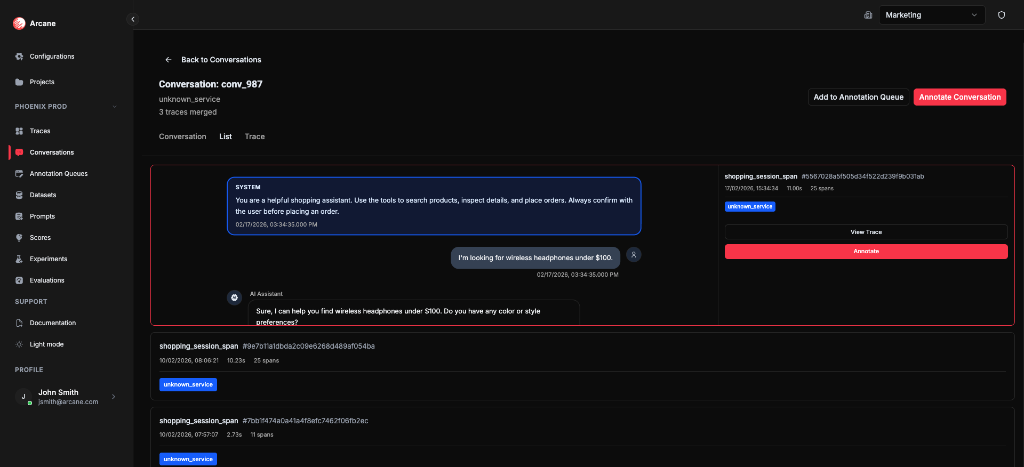
Use this view to jump from the conversation to a specific underlying trace.
Trace tab
- What it shows: A merged trace view of all spans from the conversation's traces. Same layout as the Trace detail Viewer: span tree on the left, detail panel on the right with Preview (attributes), Events, and JSON View sub-tabs.
- What you need: No extra configuration beyond what you need for the Conversation tab. Entity matching and highlights in the merged view use the same Entities configuration; if spans match entities with highlights, you'll see badges and stats in Preview. Events and JSON View always show span data.
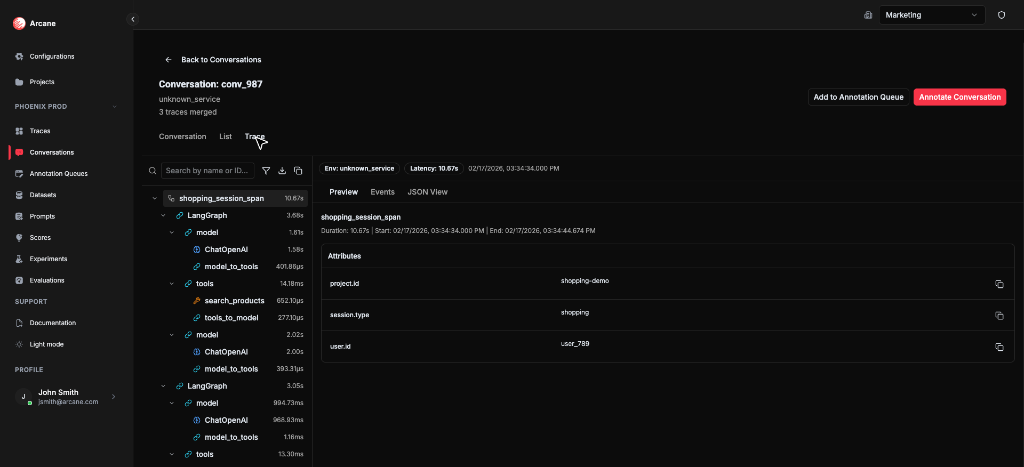
- Search by name or ID — filter spans in the tree.
- Filters — filter by Service Name, Entity, or "Show only entity spans".
- Download — download the selected span as JSON.
- Copy whole trace as JSON — copy the full merged trace to the clipboard.
Jaeger: How conversations are retrieved and computed
If you use Jaeger as your trace backend, conversations work differently than with Tempo or ClickHouse. This is due to limitations in the Jaeger API.
Overview
Jaeger fetches traces and derives conversations entirely in memory. The Jaeger API does not support attribute-based search (e.g. by session.id, project.id), so Arcane:
- Fetches traces by time range only
- Applies all filtering and conversation extraction in memory
Trace fetching
- Time range: Arcane uses the lookback/date range you select.
- Attribute search: Not supported. The Jaeger API rejects attribute-based filters. You cannot search by
session.id,project.id, or other span attributes. - Trace limit: Each search request fetches at most 10 traces. Even with a large limit, Jaeger returns a maximum of 10 traces per request.
Conversation list
- Arcane fetches traces from Jaeger for the selected time range.
- Project filter (if configured) is applied in memory.
- Conversations are extracted in memory by grouping traces that share the same value for your configured conversation attribute (e.g.
gen_ai.conversation.id). - The list shows conversation ID, name, trace count, and trace IDs.
Full conversation
- Arcane searches traces by time range.
- Traces are filtered in memory to keep only those whose attributes match the requested conversation ID.
- Full trace details are fetched one trace at a time from Jaeger.
- The merged conversation view is built from these traces.
Comparison with other backends
| Aspect | Jaeger | Tempo | ClickHouse |
|---|---|---|---|
| Attribute search | No (not supported by Jaeger API) | Yes (TraceQL) | Yes (q parameter) |
| Conversation list | In-memory from fetched traces | In-memory from TraceQL results | SQL aggregation in DB |
| Full conversation | Search → filter in memory → fetch by ID | TraceQL filter → fetch by ID | Attribute filter in query |
| Project filter | In-memory | Server-side or in query | In SQL |
| Trace limit per search | 10 (Jaeger API cap) | 10,000 | 10,000 |
Summary
- Jaeger trace search is time-based only — no attribute filters.
- Conversation list and full conversation rely on in-memory filtering and extraction.
- Project filtering is done in memory.
- Full traces are fetched individually by trace ID.
- These limitations exist because the Jaeger API does not support attribute-based search or bulk trace retrieval. For attribute search and higher trace limits, consider Tempo or ClickHouse.
When to use
- Review a full user session instead of a single trace.
- Check context — verify that context was passed correctly across turns.
- Debug ordering — find missing messages or wrong ordering.
- Annotate for review — add conversations to queues and answer questions for quality tracking. See Annotation Queues for ways to annotate.
Related
- Core Observability Concepts — how traces and conversations are built.
- Entities — matching, highlights, and message reconstruction.
- Datasources — connecting trace backends.
- Annotations & Queues — queues, questions, and annotations.
- Traces — trace search and detail view.