Events
Events are timestamped records attached to spans in a trace. In Arcane you see them in the trace detail view—per span in the Viewer, or in one chronological list for the whole trace. For the underlying concept, see Core Observability Concepts.
Where you see events
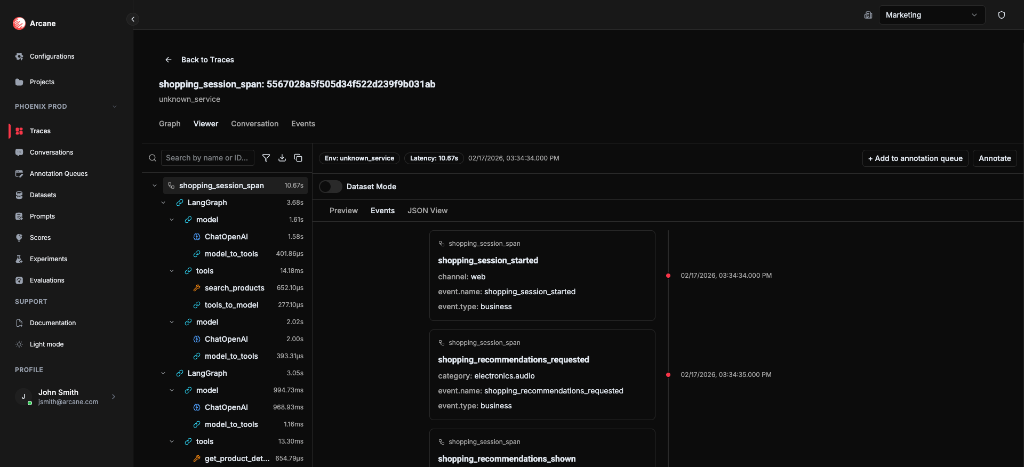
You only see events in the context of a trace. Open a trace from the Traces search, then use either:
- Viewer tab → select a span → Events sub-tab — All events for that span, in order.
- Events tab — All events from every span in the trace, in one timeline. Click an event to jump to its span in the Viewer.
If a span (or trace) has no events, the Events tab or sub-tab shows an empty state.
What events are
In OpenTelemetry, a span can have an array of events. Each event has:
- Timestamp — When it occurred (within the span’s time range).
- Name — Optional label (e.g.
model_call_started,tool_call_started,exception). - Attributes — Optional key-value pairs with details.
Events describe things that happened during the span’s lifetime—e.g. log lines, checkpoints, or lifecycle markers. They are always attached to a span: Trace → Spans → Events.
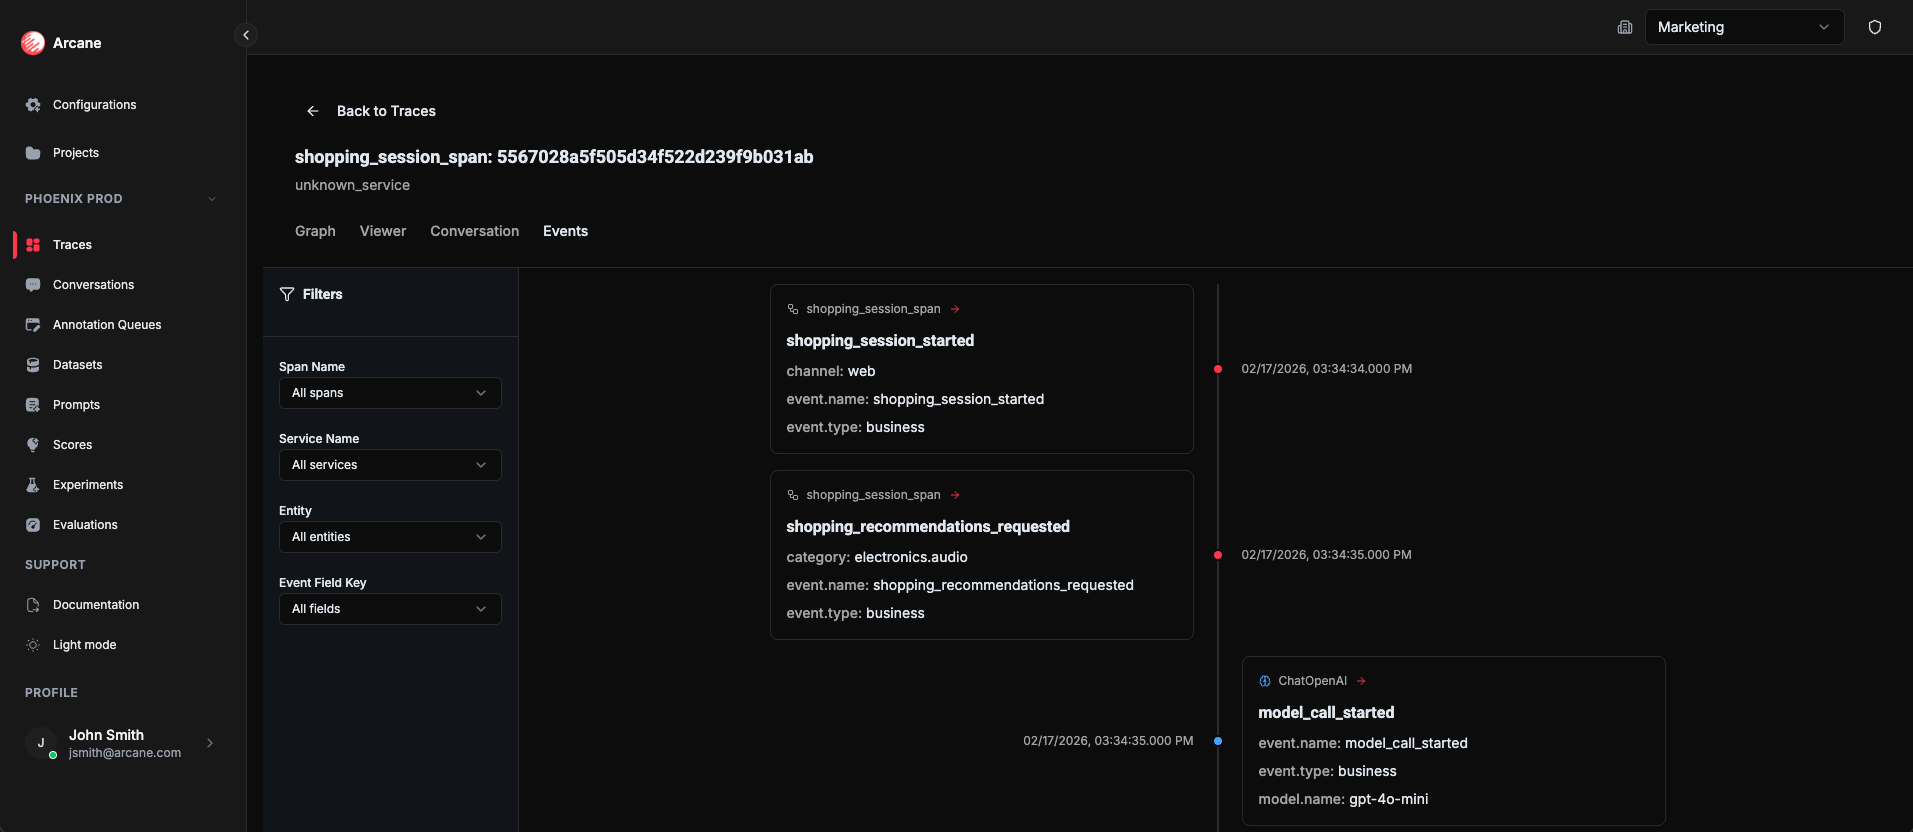
Events tab (trace-level)
The Events tab on the trace detail page shows all OTLP events from all spans in the trace, in chronological order.
Filters:
| Filter | What it does |
|---|---|
| Span Name | Show only events from spans whose name matches. |
| Service Name | Show only events from spans in that service. |
| Entity | Show only events from spans that match that entity. |
| Event Field Key | Show only events that have an attribute with that key. |
Click an event to jump to its span in the Viewer tab.
Events sub-tab (span-level)
When you select a span in the Viewer tab, the right-hand panel has an Events sub-tab. It lists all events for that span only, ordered by time. Use it when you’re focused on a single span (e.g. a model call or tool call) and want to see its internal events.
When to use
- Debug a span — See what happened inside a single span in order (e.g. token streaming, tool steps).
- Follow a trace — Use the trace-level Events tab to see the chronological sequence of events across the whole trace.
- Filter by entity or service — Narrow down to events from model spans, tool spans, or a specific service.
- Log or audit a conversation — Review the sequence of events that occurred during a conversation (e.g. message sent, model call started, tool invoked, error) for support, compliance, or product analysis.
Related
- Traces — How to open a trace and use the Viewer and Events tab.
- Core Observability Concepts — Events — How events relate to traces and spans.